Velocity/Time Graph
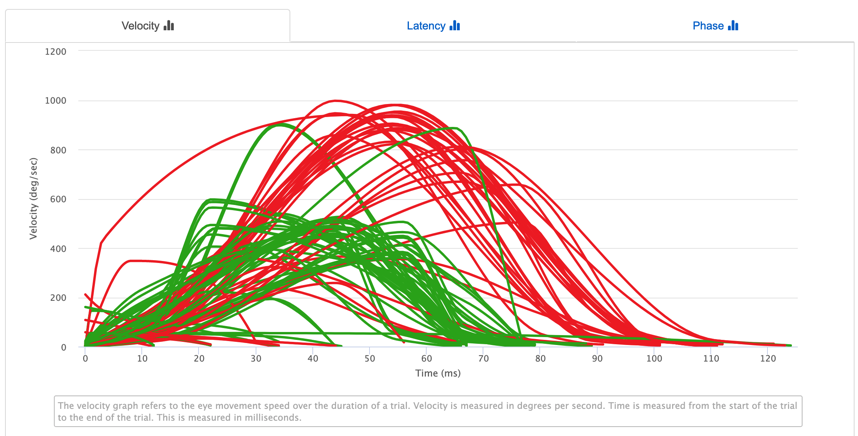
This is a velocity/time graph. The red lines denotes when the stimulus moves from the right side to the left side and the eyes motion from the right to the left. These are considered left moving trials. This is similar to the green lines which denote the stimuli moving from the left to right and the eyes moving from left to right. These are considered right moving trials. Both of these types of trials are both eye measurements, meaning it is using the average of the left and right eye gaze coordinates. They are NOT left and right eye. The colors are denoting the movement from the left side to the right side of the screen and vice versa. These definitions follow throughout the entire saccadometry test.
Latency Graph
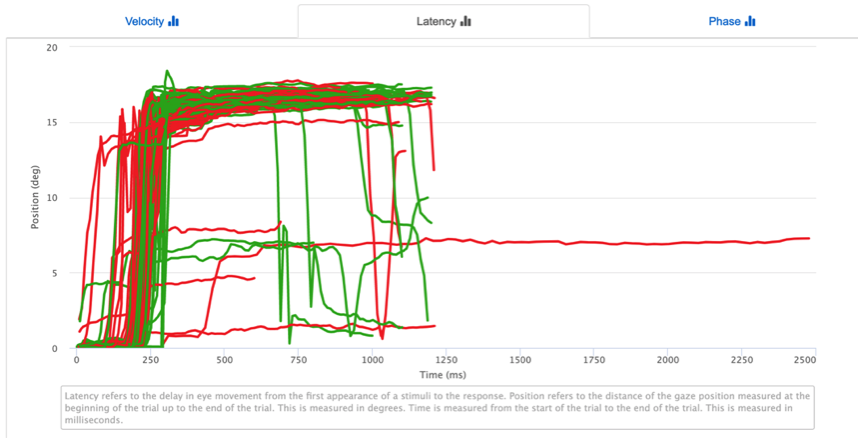
This is a latency graph. The x-axis denotes the time since the stimuli first changes from left to right or vice versa. The y-axis denotes the distance from where the gaze starts since the stimuli first appears. The latency graph tells us how long it takes to respond to the stimuli moving. The way to interpret this is to look at the first inflection point, or spike in the graph. This tells you at which point the eyes started to significantly move towards the stimulus. On this graph a noticeable change happens around 250ms which means that the latency is roughly in the window of 250ms. We can look further into this when we examine the bar graphs.
Phase Graph
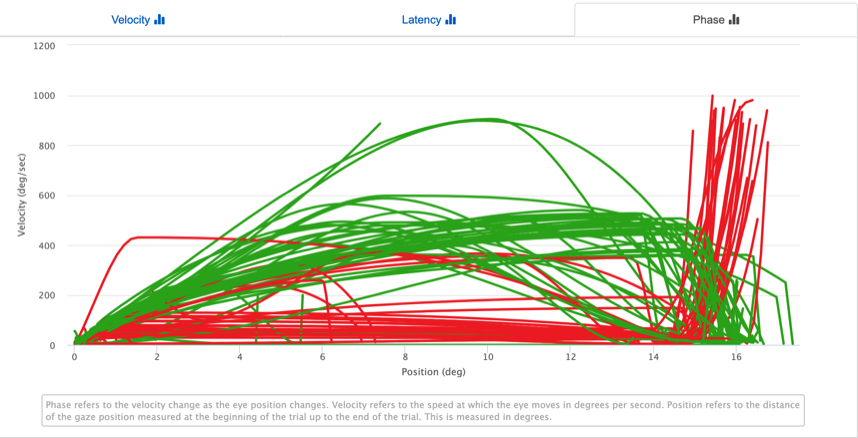
This is a phase graph. The x-axis denotes the distance from where the gaze starts since the stimuli first appears just like in the latency graph. The y-axis denotes the velocity of the gaze like in the velocity graph. This graph is useful at telling us the speed of gaze as the eyes look away from their starting location to the stimuli on the other side of the screen. Functional neurologists denote the shape of this movement as a “candy cane” like appearance where there is a speed up from the starting position to an immediate drop-off when the user gets to the stimuli.
Trial Chart
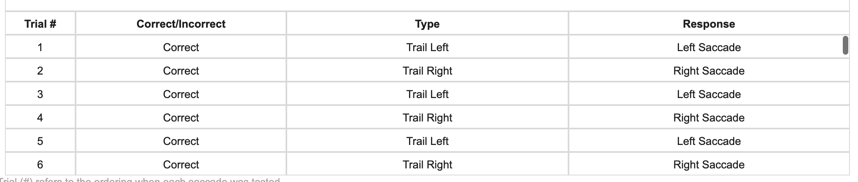
These are below each of the line graphs. These denote which lines where drawn and whether or not they met a certain criteria in terms of meeting minimum and maximum thresholds of eye movement.
Amplitude Bar Graph
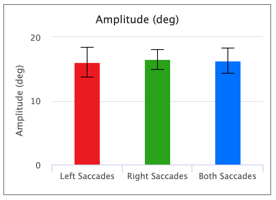
The coloring used is similar to the line graphs. The “Both Saccades” bar is used to denote the considerations of all trials together.
The amplitude is a measurement of the mean saccade amplitude for each trial. The saccade amplitude is the maximum height, in this case in the x direction, of the saccade. The error bars denotes the +/- std deviation of the amplitude. The rest of the bar graphs will have error bars that denote the +/- standard deviation from the mean.
Saccade Count
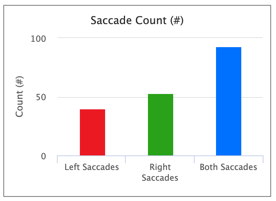
The coloring used is similar to the line graphs. The “Both Saccades” bar is used to denote the considerations of all trials together.
The saccade count graph tells us the number of saccades that were ”correct” and drawn on the screen. In the both saccades bar, that is the sum of the left and right saccades.
Duration (ms)
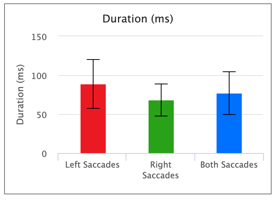
The coloring used is similar to the line graphs. The “Both Saccades” bar is used to denote the considerations of all trials together.
The duration graph is the measure of how long a saccade was during each trial in milliseconds.
Latency (ms)
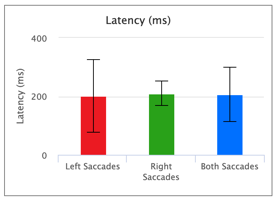
The coloring used is similar to the line graphs. The “Both Saccades” bar is used to denote the considerations of all trials together.
The latency is the measure of the time it takes to respond to the stimuli’s first appearance. This is a clearer description of what the latency line graph can tell us.
Mean Velocity (deg/sec)
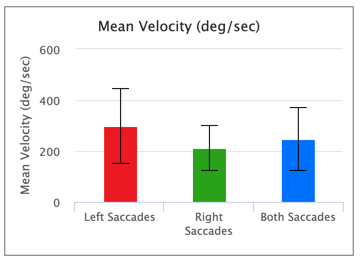
The mean velocity is a measure of the average velocity of a single trial. The output is the mean of each average velocity for each trial.
Peak Velocity (deg/sec)
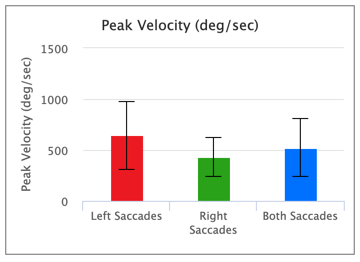
The peak velocity is the maximum velocity for each trial which is then averaged over all trials.
Q-Ratio (peak/mean velocity)
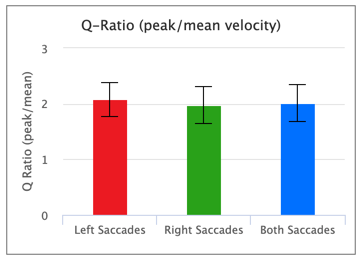
The Q-Ratio is directly related to mean and peak velocity. It is the measure of the peak/mean velocity.
Bar Graphs (All Trials)
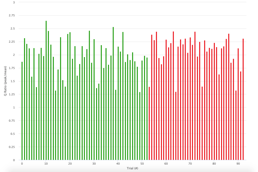
The bar graphs for all trials have the same definitions for the other bar graphs. Each bar element represents one trial or one movement from left to right or right to left.
Saccadometry Test Reliability Testing
|
Metric |
Trial |
Mean |
CA |
|
Count Left Saccades (#) |
T1 |
32 |
0.82 |
|
T2 |
36 |
||
|
Count Right Saccades (#) |
T1 |
42 41 |
0.72 |
|
T2 |
|||
|
Count Both Saccades (#) |
T1 |
75 76 |
0.82 |
|
T2 |
|||
|
Amplitude Left Saccades (deg) |
T1 |
21 21 |
0.87 |
|
T2 |
|||
|
Amplitude Right Saccades (deg) |
T1 |
21 21 |
0.95 |
|
T2 |
|||
|
Amplitude Both Saccades (deg) |
T1 |
21 21 |
0.91 |
|
T2 |
|||
|
Latency Left Saccades (ms) |
T1 |
201 195 |
0.79 |
|
T2 |
|||
|
Latency Right Saccades (ms) |
T1 |
204 205 |
0.87 |
|
T2 |
|||
|
Latency Both Saccades (ms) |
T1 |
203 200 |
0.88 |
|
T2 |
|||
|
Mean Velocity Left Saccades (deg/sec) |
T1 |
253 251 |
0.7 |
|
T2 |
|||
|
Mean Velocity Right Saccades (deg/sec) |
T1 |
237 228 |
0.83 |
|
T2 |
|||
|
Mean Velocity Both Saccades (deg/sec) |
T1 |
244 240 |
0.91 |
|
T2 |
|||
|
Peak Velocity Left Saccades (deg/sec) |
T1 |
502 492 |
0.82 |
|
T2 |
|||
|
Peak Velocity Right Saccades (deg/sec) |
T1 |
493 470 |
0.85 |
|
T2 |
|||
|
Peak Velocity Both Saccades (deg/sec) |
T1 |
499 484 |
0.92 |
|
T2 |
|||
|
Duration Left Saccades (ms) |
T1 |
58 57 |
0.89 |
|
T2 |
|||
|
Duration Right Saccades (ms) |
T1 |
69 67 |
0.91 |
|
T2 |
|||
|
Duration Both Saccades (ms) |
T1 |
65 63 |
0.94 |
|
T2 |
|||
|
Q-Ratio Left Saccades (peak/mean) |
T1 |
1.9 1.9 |
0.78 |
|
T2 |
|||
|
Q-Ratio Right Saccades (peak/mean) |
T1 |
2.0 2.0 |
0.79 |
|
T2 |
|||
|
Q-Ratio Both Saccades (peak/mean) |
T1 |
2.0 1.9 |
0.88 |
|
T2 |
ms = milliseconds; deg = degrees of visual angle; deg/sec = degrees per second; T1 = test 1; T2 = test 2; CA = Cronbach’s Alpha
Saccadometer Overall Alpha Score: 0.85
N = 20, males and females. All healthy.