|
The Sports Vision assessment and report provide objective data on eye movements, brain processing, and reaction time which can help assess athletic performance. Data from the Sports Vision report can be used to help illustrate any areas of weakness, inform training strategies and help track eye movement changes. Report Components: |
|
 |
Skill Levels
Prior to starting the Sports Vision test, users must select a relevant athletic Skill Level. Results display percentiles when compared to other athletes who have self-reported one of five different skill levels. The comparisons are based on Murray, et al (2019). Skill levels are:
- Professional: A person is identified as a Professional level player, if he/she plays for a professional sports club or a National level team.
- College: A person is identified as a College level player, if he/she plays for a College or University Sports team.
- Elite Youth: A person, who is competing at a high level in their sport but do not identify himself/herself in one of the above two categories (example would be a Travel Team or someone who is competitive at the county or state level).
- Youth: A person aged between 5 and 16 years, and who does not identify himself/herself as one of the above three categories.
- Amateur: Any person, in any age group, who is a recreational athlete.
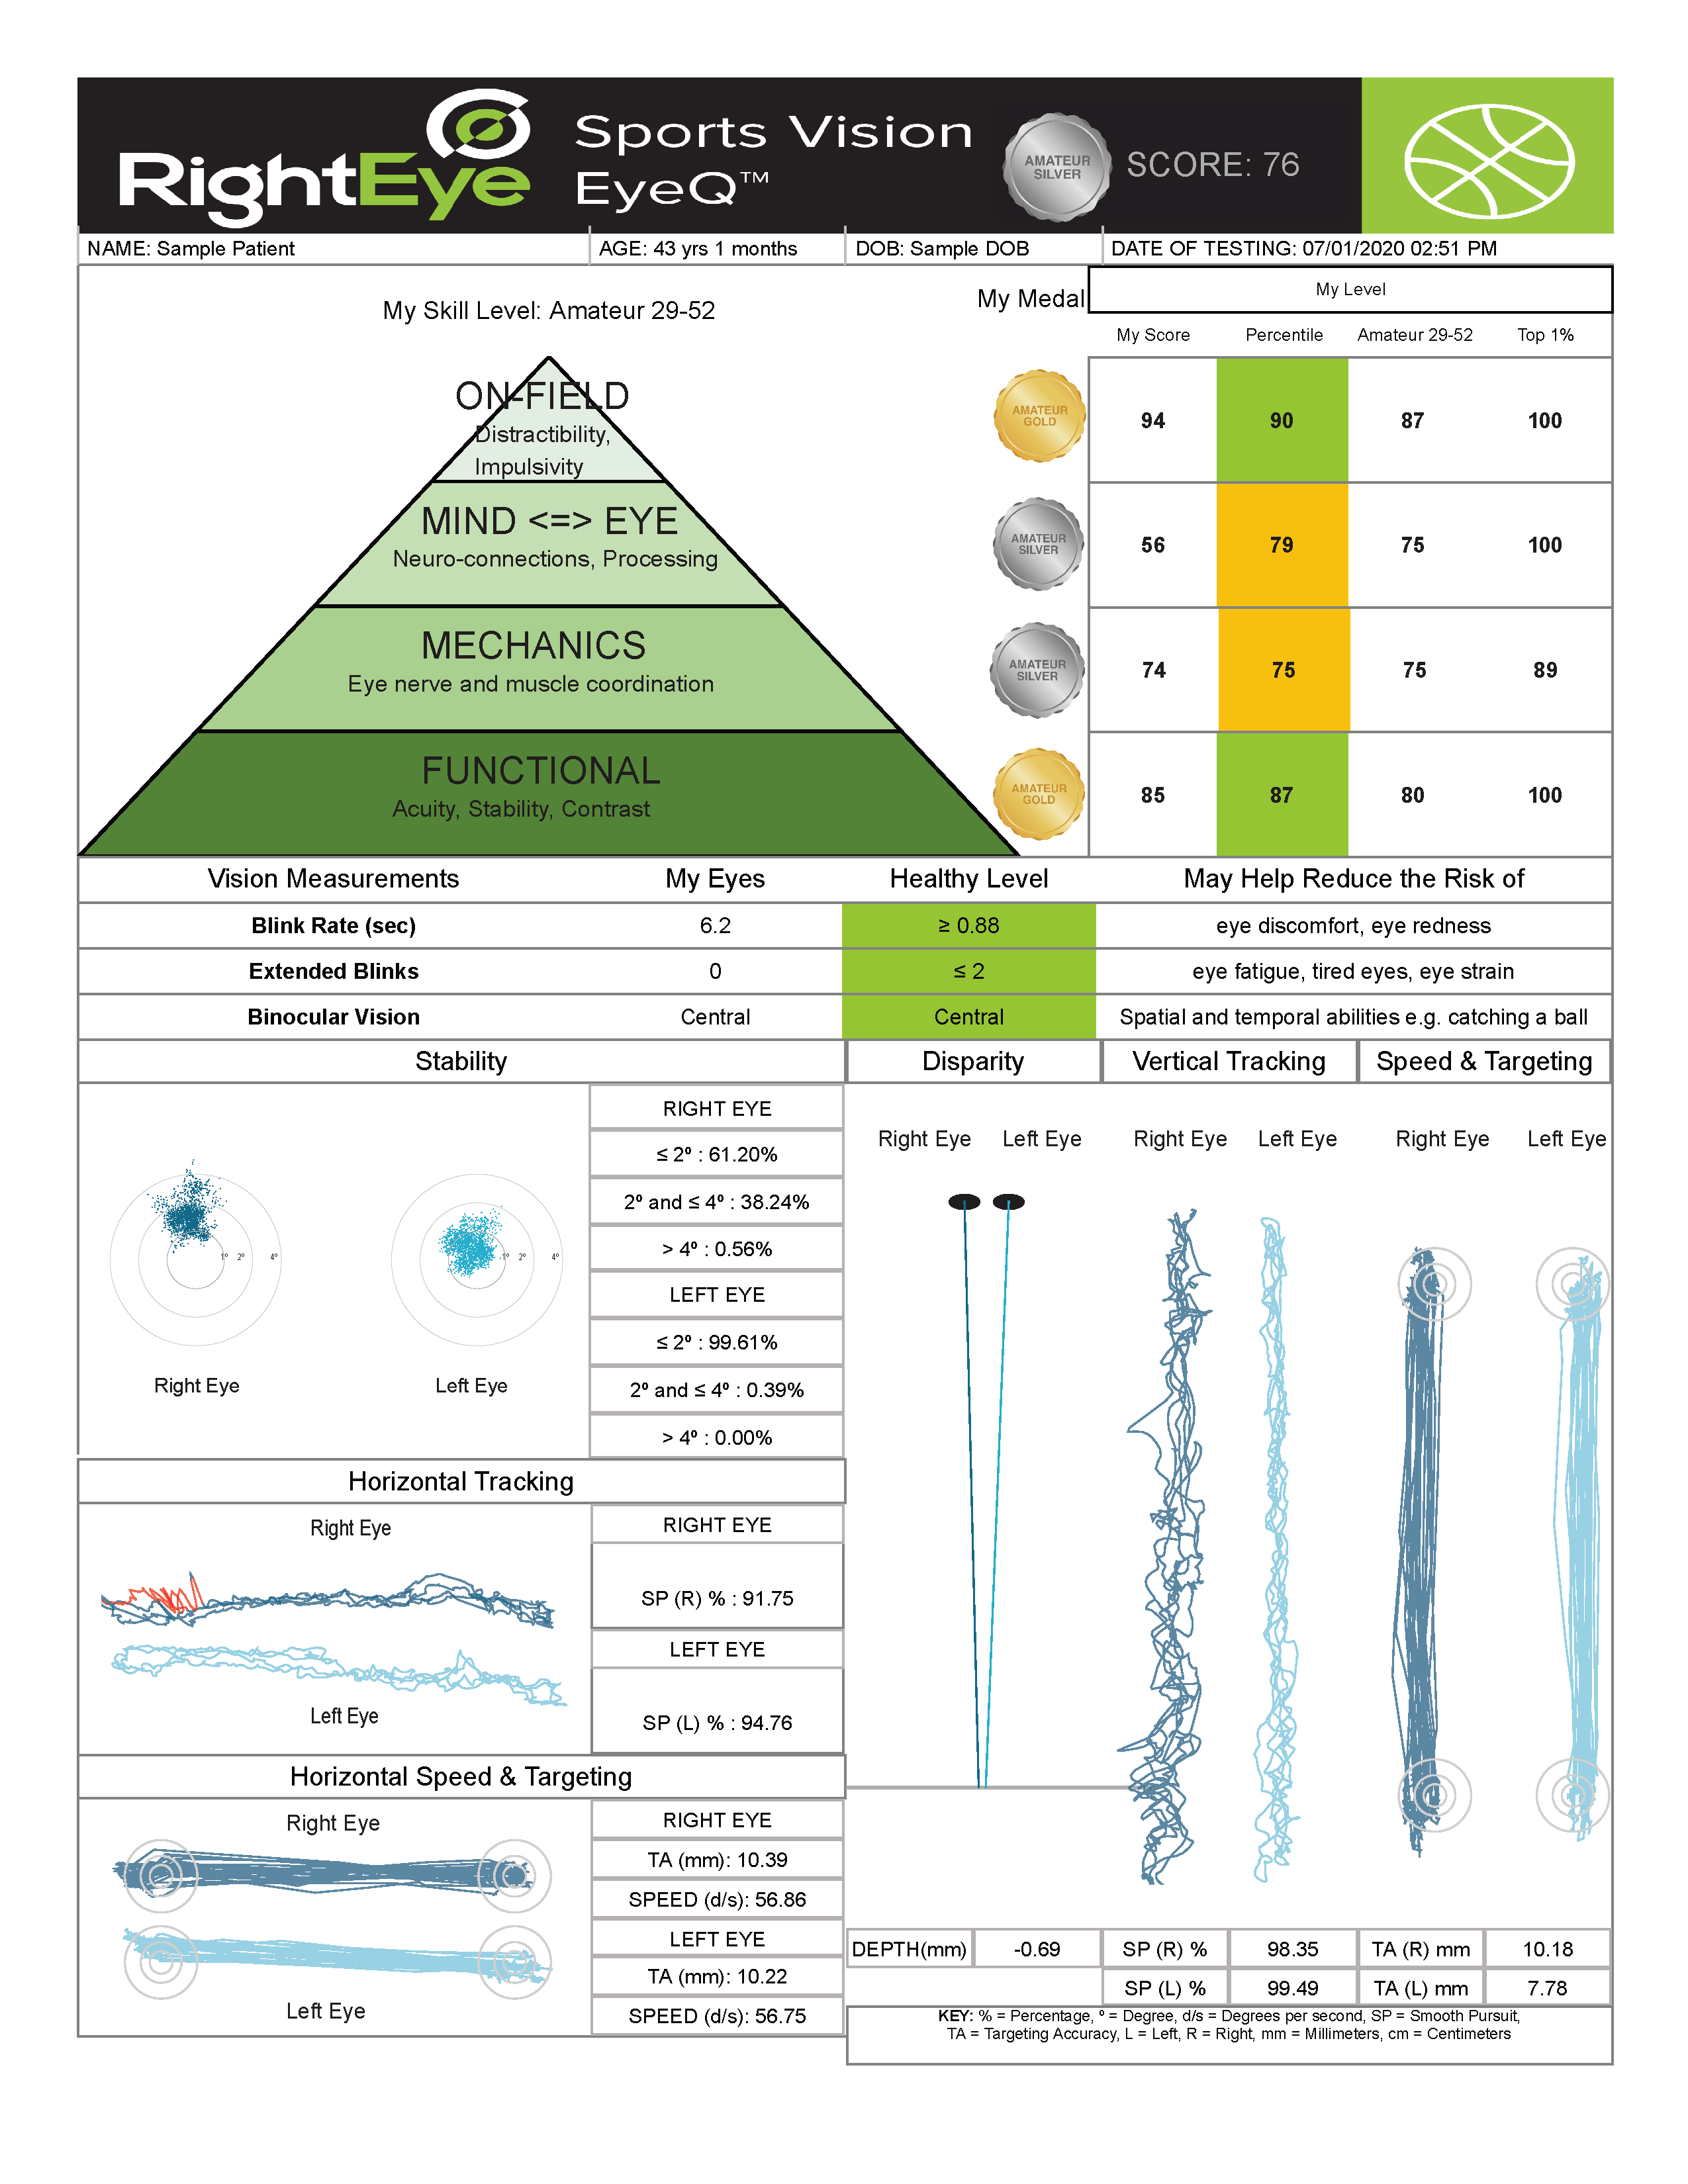
Sports Vision Pyramid
The Sports Vision Pyramid consists of 4 components of vision that impact your performance. Starting from the bottom: Functional Vision, Mechanics, Mind-Eye, and On-Field. Each component is inter-dependent, meaning that poor results at the bottom of the pyramid can affect results at the top of the pyramid.

Functional
At the base of the Sports Vision Pyramid is Functional Vision: the foundation of all vision. Functional Vision relates to the ability to have basic fundamental visual health and functionality. The score for the functional vision layer is calculated from:
-
Static (Visual) Acuity: is the ability to see stationary objects clearly (20/20), such as reading a play book. A lower number is better.
-
Dynamic (Visual) Acuity: is the ability to see moving objects (object size fixed) clearly, such as tracking a ball, or reading hand signals. A higher speed (mph) is better.
-
Contrast Sensitivity: is a very important measure of visual function, especially in situations of low light, fog, or glare (e.g. the sun), when the contrast between, for example the white ball and the grey clouds is reduced. A low ability in contrast may affect a performance on cloudy days or in night games. Scores range from 2-8. A higher number is better.
- Fixation Stability: is the ability to keep the eyes stable and fixed on a certain spot for a period of seconds. A higher percentage within a 2 degree bandwidth is best.
- Blink Rate: is associated in scientific research with dry eyes, visual clarity and fatigue. Blink rate of greater than 1.6 is considered normal.
- Extended Blinks: refers to eye closure of greater than 1 second. Long closures of the eye are shown in scientific research to relate to tired eyes, visual fatigue. Ideally, less than 2 extended blinks are the best result.
- Depth: refers to the point at which the eyes converge compared to the point of focus. A negative number means the point of convergence is further than the required focus point. A positive score means the point of convergence is closer than the required focus point. Zero is a perfect score.
Mechanics
Mechanics refers to the eyes teaming together and muscle and nerve coordination to maintain effective and efficient use of the eyes, including:
- Tracking ability (SP%): refers to the ability of both eyes working together to follow an object such as a ball. A higher number is better.
- Latency: refers to the amount of time it takes the eyes to react when a target is presented. Like reacting to a starter gun with physical movement of your legs, but in this case, we are referring to your eye movement. A lower number is better.
- Efficiency: refers to the path your eyes take from one target to the other. Like running bases in baseball, are you taking the most efficient pathway or are you taking extra steps or distance which can increase the time it takes to get to your next visual target. A lower number is better.
- Targeting Accuracy (TA): refers to the accuracy between the target and where your eye hits. Value represents how far off the gaze is from target. A lower number is better.
- Speed: refers to the velocity of your eyes. A higher number paired with a low number in targeting is better.
- Speed Accuracy Trade-off: refers to the trade-off that occurs between moving your eyes quickly but also being accurate. Depending on the sport, you may need one more than the other, or both equally.
- Recovery: refers to the difference between gaze paths when eyes try to move away from one target to look at another target. This is indicative of the adjustment required by the eyes to stay on a visual line path which can cause increased response time. A lower number is better.
- Binocular Vision: refers to whether your eyes are “teaming” or working well together. 'Central' is best result.
- Variance: refers to the variability or dispersion when trying to move eye gaze between targets. This is indicative of inconsistent eye gaze when changing focus between targets which can reduce the accuracy with certain activities in sports. A lower number is better.
Mind-Eye
Mind-Eye refers to the interplay of vision and neuro-connectivity to include visual processing, including:
- Processing time: refers to the time it takes to “think” once something is seen. A lower number is better.
- Decision making accuracy: refers to the outcome of the thought and whether your response was correct or incorrect. A higher number is better.
- Reaction time: refers to how quickly you responded to the task. A lower number is better.
On-Field
On-Field refers to how environmental factors can influence performance including vision via motor responses, including:
- Distractibility: refers to your ability to pay attention to the task at hand. A lower number is better.
- Impulsivity: refers to your ability to be “patient”, waiting for the information to present itself before responding. A lower number is better.
My Level
Results for each component are shown to the right of the Pyramid. A user's score for each component is shown in the My Score column, alongside their skill level percentile, the average score for their skill level and age group, and the average score of the Top 1% of their skill level.
Medals are also awarded based on score.

The average of all 4 components is shown at the top of the report as Total Score along with a Medal.

Sports Vision Trainer

A link to the Sports Vision Trainer library is included in each report just below the Sports Vision Pyramid and My Score sections. Sports Vision Trainer exercises can be incorporated into the weight room, warm-up and practice drills athletes are already engaged in. For example, to practice tracking abilities balls of different colors are used and athletes need to call the color of the ball when it is first in flight.
To read more about Sports Vision Trainer, click here.
Vision Measurements
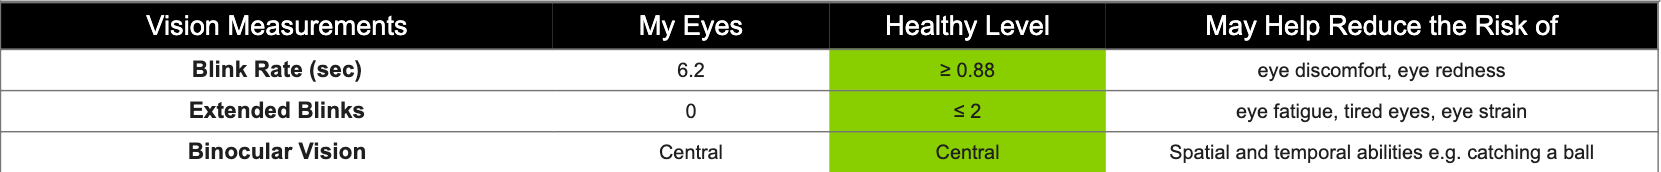
- Blink rate (sec): number of blinks per second during testing. Blink rate of greater than 1.6 is considered normal.
- Extended Blinks: number of times the eyes were closed for more than 1 second. Long closures of the eye are shown in scientific research to relate to tired eyes, visual fatigue. Ideally, less than 2 extended blinks are the best result.
- Binocular Vision: displays the average location of the user's vision, which can indicate whether the eyes are "teaming" or "working well together." Central is best result.
Color Ranges for Vision Measurements
| Blink Rate (sec) | 1.6 or higher | 0.88 - 1.5 | 0.87 or lower |
| Extended Blinks | 1 or fewer | 1 - 2 | more than 2 |
| Binocular Vision | Central | Poor Central | Eccentric |
Links to peer-reviewed research articles relating to each Vision Measurement are also included in the Guidelines on page 2.

Eye Movement Visualizations
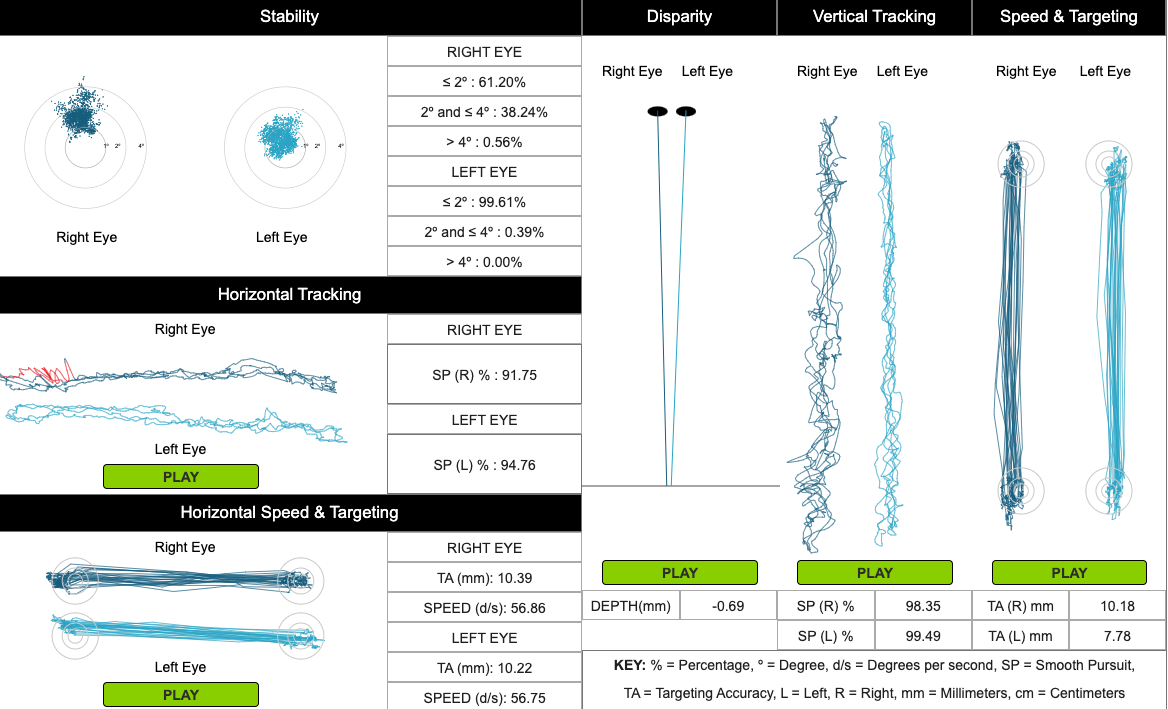
Visualizations from select eye movement tests are shown on the bottom half of the report, along with relevant metrics.
- Stability - from Fixation Stability test, and includes gaze dispersion metrics
- Horizontal Tracking - from Horizontal Smooth Pursuit, and includes SP% (% of smooth pursuit)
- Horizontal Speed and Targeting - from Horizontal Saccades, and includes TA (target accuracy) and Speed (degrees/second)
- Disparity - this is a top-down view of the user's disparity during the Horizontal Smooth Pursuit test and includes Depth (mm), which shows where the eyes converged on average. A positive number indicates eyes crossing over before the screen, a negative number indicates eyes crossing over behind the screen, and a 0 value indicates the eyes converged exactly on the screen. Closer to 0 is best.
- Vertical Tracking - from Vertical Smooth Pursuit, and includes SP% (% of smooth pursuit)
- Vertical Speed and Targeting - from Vertical Saccades, and includes TA (target accuracy) and Speed (degrees/second.
Distance
The average distance during testing is located at the bottom of the report, below the disclaimer. Be sure to check the distance on each report, as testing outside of the recommended range can affect report reliability.
