|
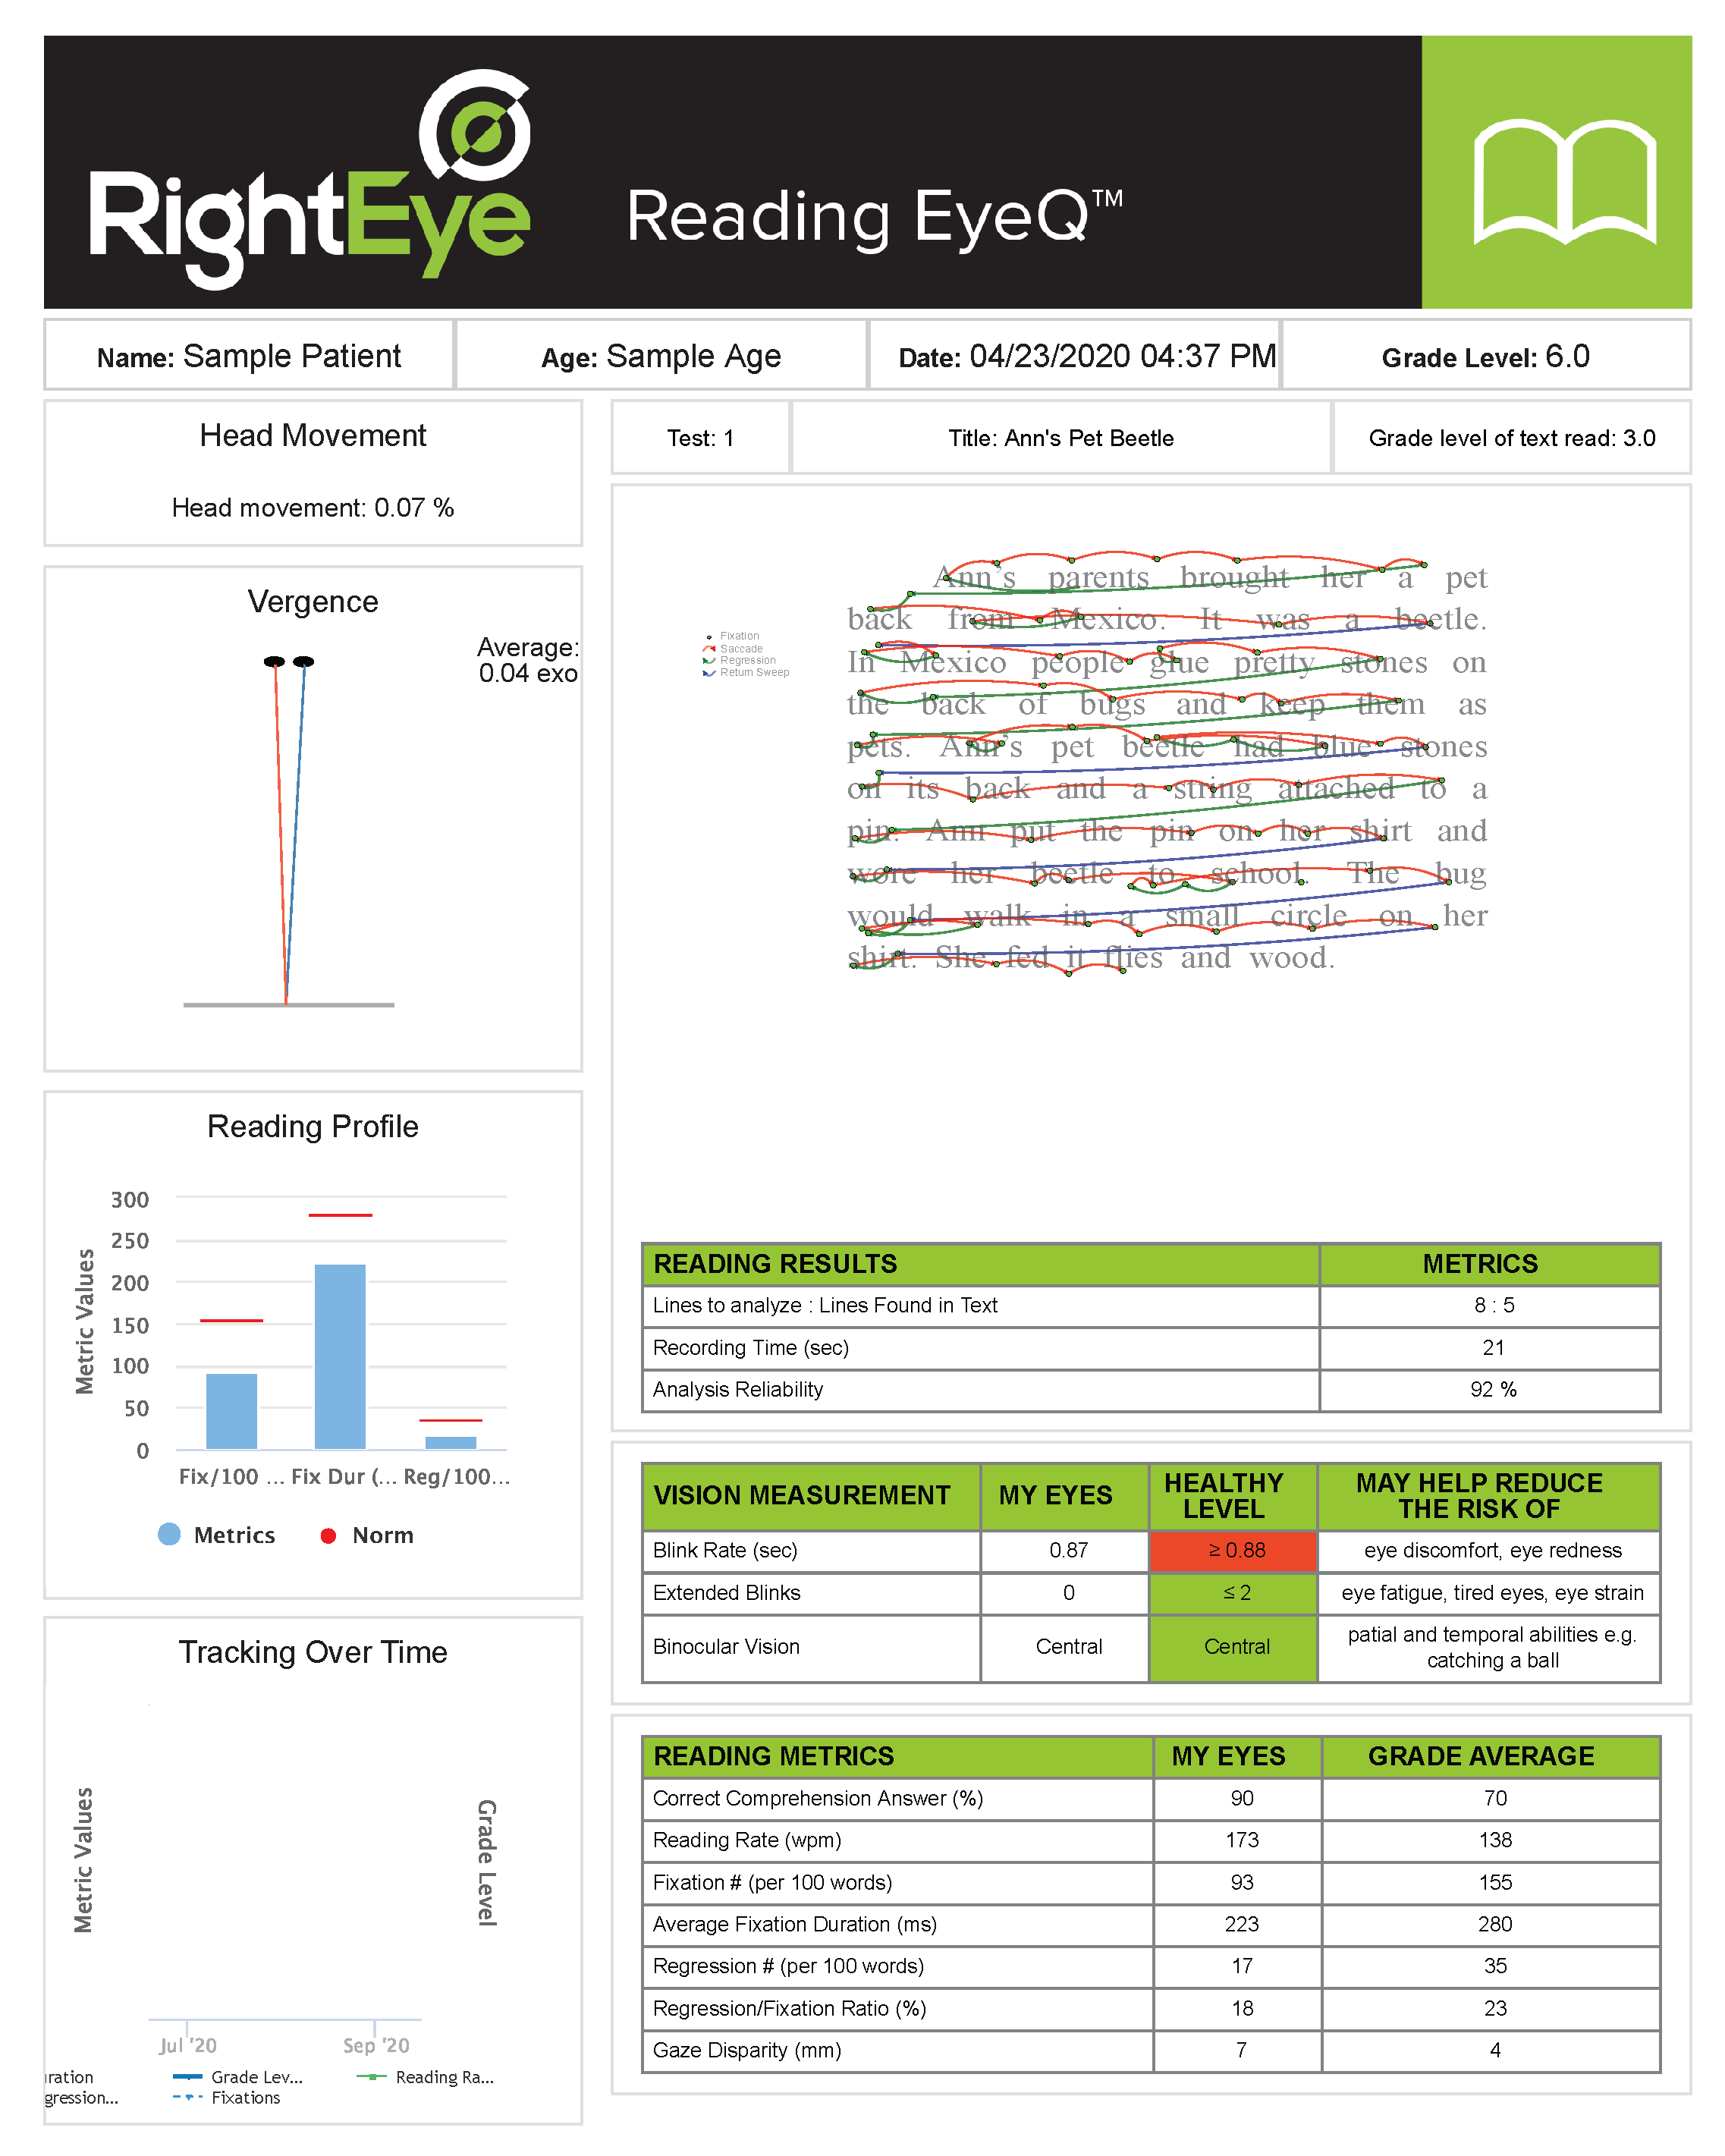
The Reading Skills assessment and report can help assess and illustrate possible deficiencies in reading and binocular vision issues. While it’s typically used with youth readers, it also can be used to assess those recovering from brain injury of any kind and can help provide objective evidence of progress. Report Components: |
|
 |
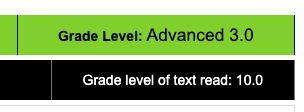
Grade Level Equivalent
Grade Level Equivalent is shown at the top of the report, based on their reading rate (words per minute) compared to the norms for the Grade level of text read.
Grade Level Equivalents will range from 1.0 to 12.0 (US public school grade levels), then College, and then the highest levels, Advanced 1.0 to 5.0.
| For US Grade Level... | Choose Story Level.. | English | French | Spanish | Dutch | |
| 1st Grade | Short Story - 1 |
|
|
|
|
|
| 2nd Grade | Short Story - 2 |
|
|
|
|
|
| 3rd Grade | Short Story - 3 |
|
|
|
|
|
| 4th Grade | Short Story - 4 |
|
|
|
|
|
| 5th Grade |
Short Story - 5 Long Story - 5 |
|
|
|
|
|
| 6th Grade |
Short Story - 6 Long Story - 6 |
|
|
|
|
|
| 7th Grade |
Short Story - 7 Long Story - 7 |
|
|
|
|
|
| 8th Grade |
Short Story - 8 Long Story - 8 |
|
|
|
|
|
| 9th Grade |
Short Story - 9 Long Story - 9 |
|
|
|
|
|
| 10th Grade+ |
Short Story - 10 Long Story - 10 |
|
|
|
|
|
Reading Gaze Path
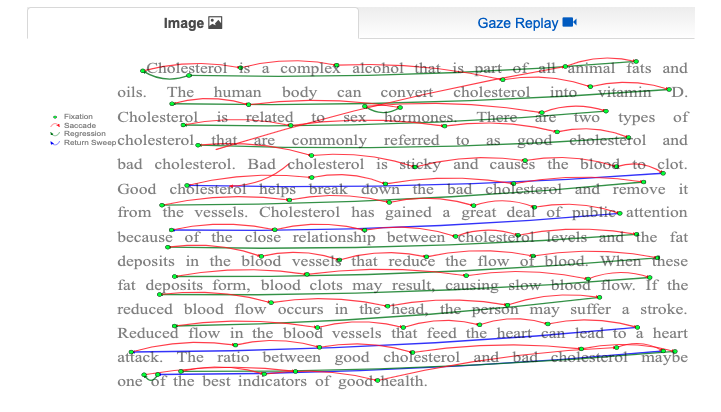
A diagram of the user's gaze path during reading is shown in the center of the report. The eye movements are notated as follows:
- Fixations - fixations are denoted by a green dot. These locations are where the eyes stopped during reading, and where content is absorbed.
- Saccades - saccades are denoted by red lines connecting fixations (green dots). Saccades are quick eye movements between words.
- Regressions - regressions are denoted by green lines and occur when a reader backtracks to re-read along the same line. You may expect to see a high number of regressions over particularly difficult words.
- Return Sweep - return sweeps are denoted by blue lines. Return sweeps occur when a reader reaches the end of a line and moves their eyes to the beginning of the next line. Note: You may see some return sweeps denoted with green lines as Regressions if the User's eyes initially land on the same line during the return sweep.
Gaze Replay
A gaze replay is located on the second tab next to the gaze path image. You can use this video replay to show a user where their eyes landed as they were reading. Press B to start the replay. The gaze relay also includes speed controls (0.5x speed, 1x speed, or 1.5x speed) as well as Play, Pause and Stop buttons.
Reading Results
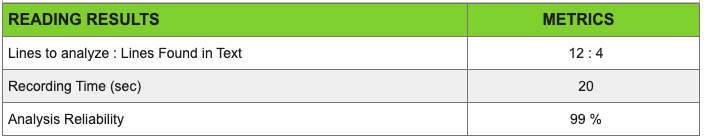
The Reading Results table shows four metrics:
- Lines to analyze: the number of lines of text that were shown, minus the first and last lines.
- Lines Found in Text: the number of lines found by the reader, as defined by return sweeps.
- Recording Time (sec): the amount of time useful data was recorded. Recording time is one factor that influences analysis reliability.
- Analysis Reliability: refers to the level of confidence in the report metrics and outcome. If you receive an analysis reliability score lower than 80%, please retest. It is important to be sure that the reader has successfully calibrated and is seated at the required distance to obtain high reliability analysis scores.
Vision Measurements
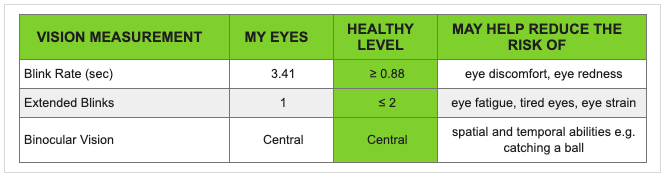
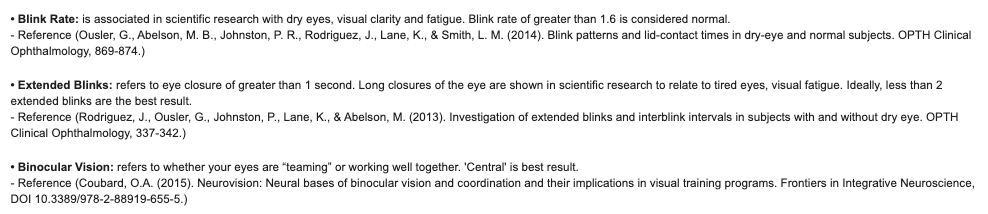
- Blink rate (sec): number of blinks per second during testing. Blink rate of greater than 1.6 is considered normal.
- Extended Blinks: number of times the eyes were closed for more than 1 second. Long closures of the eye are shown in scientific research to relate to tired eyes, visual fatigue. Ideally, less than 2 extended blinks are the best result.
- Binocular Vision: displays the average location of the user's vision, which can indicate whether the eyes are "teaming" or "working well together." Central is best result.
Color Ranges for Vision Measurements
| Blink Rate (sec) | 1.6 or higher | 0.88 - 1.5 | 0.87 or lower |
| Extended Blinks | 1 or fewer | 1 - 2 | more than 2 |
| Binocular Vision | Central | Poor Central | Eccentric |
Links to peer-reviewed research articles relating to each Vision Measurement are also included in the Guidelines on page 2.
Reading Metrics
Reading metrics measured during the test are shown in a table at the bottom of the report. If the Grade Level Equivalent is significantly different than expected, look here to see for any large discrepancies between the user's results ("My Eyes") and the Grade Average.
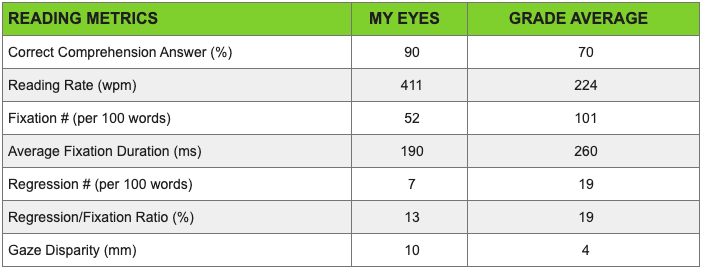
- Correct Comprehension Answer %: refers to the number of questions answered correctly. If this number is below 70%, then we recommend retesting with a lower grade level of text.
- Reading Rate: how many words were read per minute, calculated using the number of words in the selected text and the recording time.
-
Fixations/100 Words (#): a stopping point of the eyes, represented per 100 words of text read.
- Average Fixation Duration: the average amount of time the reader stopped (fixated) while reading.
- Regression # (per 100 words): the number of time the reader looked backwards, in English content this is from right to left, while reading.
-
Regression/Fixation Ratio (%): regressions divided by fixations represented as a percentage.
-
Disparity (mm): the difference between the left and right eye taken at fixations then divided by the number of fixations. Represented in millimeters.
Head Movement
Head Movement is shown in the upper left of the report as a percentage of movement done with the head vs. movement done with the eyes.
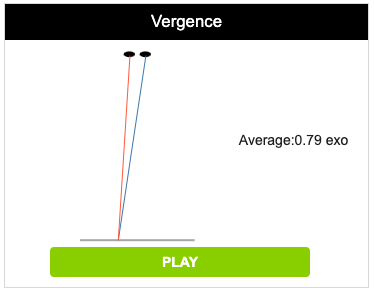
Vergence
Vergence refers to the ability to coordinate and use both eyes as a team. Vergence indicates the point at which the eyes converge compared to the reading stimuli.
From this top-down perspective, the gray line indicates the top of the RightEye Vision System screen.
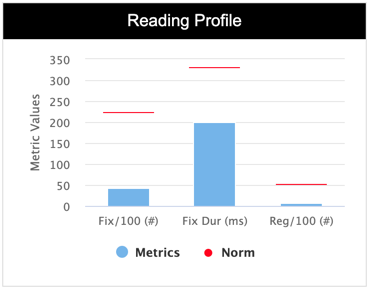
Reading Profile
The Reading Profile chart shows report results as compared to grade level norms. Grade level norms are indicated by the red lines, and the report results are shown in the blue columns for Fixations/100 words (#), Fixation Duration (ms), and Regressions/100 words (#).
For a functional reader, each of these three metric values should be at or lower than the grade level average. Values that greater than the red lines indicate poor performance.
Tracking Over Time
Tracking Over Time displays metric results for current and previous reading tests from the same User ID.
Metrics tracked include Duration, Grade Level Equivalent, Reading Rate, # Regressions, and # Fixations.
![]()
Distance
The average distance during testing is located at the bottom of the report, below the disclaimer. Be sure to check the distance on each report, as testing outside of the recommended range can affect report reliability.
